ダウンロードしたフォルダは図のような構成です。
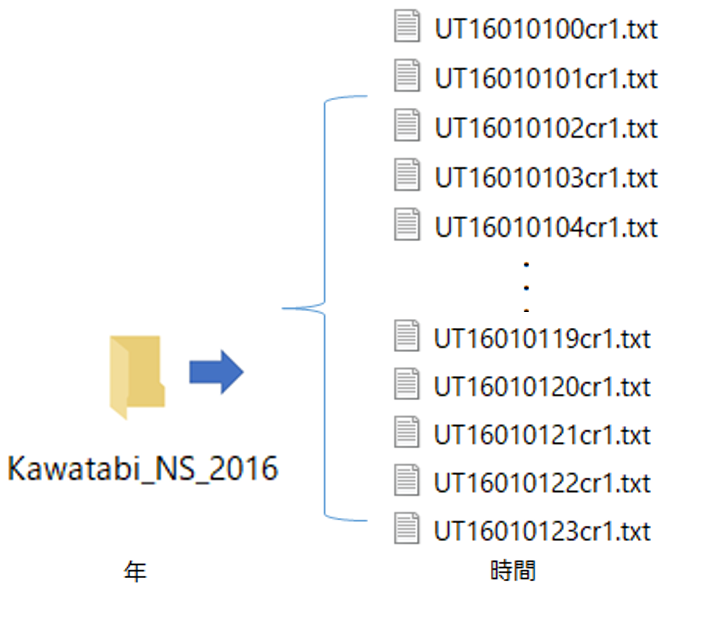
Kawatabi_NS_2016
Kawatabi(observation site), NS(North-south component), 2016 (year)
Kawatabiは宮城県川渡を、NSはNS(南北)成分を、2016は2016年を表しています。
The folder has 8760 files (365 days times 24 hours) of spectra at most.
フォルダを開くと、最大8760個(365日×24時間)のファイルがあります。
Each file is named as UTyymmddhhcr1.txt, where yy, mm, dd, hh are year, month, date, hour, respectively.
ファイル名UTyymmddhhcr1.txtのyy, mm,dd, hh は年、月、日、時
The file UT16010100cr1.txt contains spectra obtained during the period from 00 UT to 01 UT on 2016 Jan 01.
ファイル UT16010100cr1.txtは2016年01月01日0時 - 1時に観測された地磁気変動のスペクトルです。
cr1/cr2 indicates which one of two magnetometers were used.
The spectra are calibrated for each magnetometer's frequency response.
See the page Magnetometers for the frequency response.
cr1、cr2は、2台ある磁力計のうちどちらを使ったかを表しています。1台ごとに感度特性が違います。
ダウンロードしたファイルはcr1、cr2どちらも感度補正してあります。
詳しくは磁力計のページの周波数特性をご覧下さい。
For example, see the file UT16010100cr1.txt.
例としてUT16010100cr1.txtを開くと、以下のようなデータが表示されます。
These are 2-min averages of the spectra calculated by 8 sec DFT.
8秒ずつDFTした結果を2分平均したスペクトルです。
16 1 1 0 0 0 ※yy,mm,dd,hh,min,sec (start time) / 最初の1行は開始日時2016年01月01日0時0分0秒を表します。
1 5.206466E-02 ※mode number, amplitude /2行目から周波数番号と振幅の値が並んでいます。
2 2.458484E-03 ※mode number times 0.125 Hs gives the frequency /周波数番号×0.125 Hz が周波数となります。
3 1.860365E-03
4 7.773726E-04
5 6.075326E-04
6 3.602743E-04
7 4.284196E-04
8 2.831444E-04
9 2.855342E-04
10 2.391421E-04
:
351 4.288001E-05
352 4.140213E-05
353 4.663262E-05
354 4.301907E-05
355 4.585909E-05
356 4.408405E-05
357 4.377078E-05
16 1 1 0 2 0 ※Next period (0:2:00-) starts here / ここから次の0時02分0秒が始まります。
1 4.769990E-02
2 3.225219E-03
3 1.272880E-03
4 8.774945E-04
5 5.207221E-04
6 4.659850E-04
7 3.599851E-04
8 2.431239E-04
9 2.226698E-04
10 1.901749E-04
:
Example: mode number =2 amplitude 5.206466E-02 means frequency 0.125 Hz and amplitude 5.206466×10⁻² [nT]
例:2行目の「1 5.206466E-02」は周波数0.125[Hz]、振幅5.206466×10⁻² [nT]という意味です。
Square of the amplitude divided by the frequency resolution 0.125Hz gives the power density 2.2×10⁻²[nT2/Hz].
この振幅を2乗し、周波数分解能0.125Hz で割るとパワー密度=2.2×10⁻²[nT2/Hz](power density)になります。
The mode number ends at 357 (= 44.625Hz), followed by the next set of the spectra.
周波数、振幅の値は2分間で357個あり、また次の2分間というように1時間分繰り返されていきます。
Each file has spectra for 1 hour (30 sets of 2-min averages).
A daily dynamic spectra is produced with 24 files a day.
1ファイルに1時間分のスペクトルがあるので、
これを24時間分まとめることによって
1日分のダイナミックスペクトルを描くことが出来ます。